In this assignment you are going to write a patch to visualize or sonify a data set (or both). In the first case, you will use the values of items in the data set to adjust properties of graphics in an Lcd object. The kinds of graphics that you use for visualization are completely up to you. You might decide, for example, to tie one data field to the colour of an object and another data field to its shape. In the second case, you will use the values of items in the data set to specify the pitch, duration, timing or program of MIDI notes. You are welcome to combine both visual and sonic elements in your patch.
Getting the Data
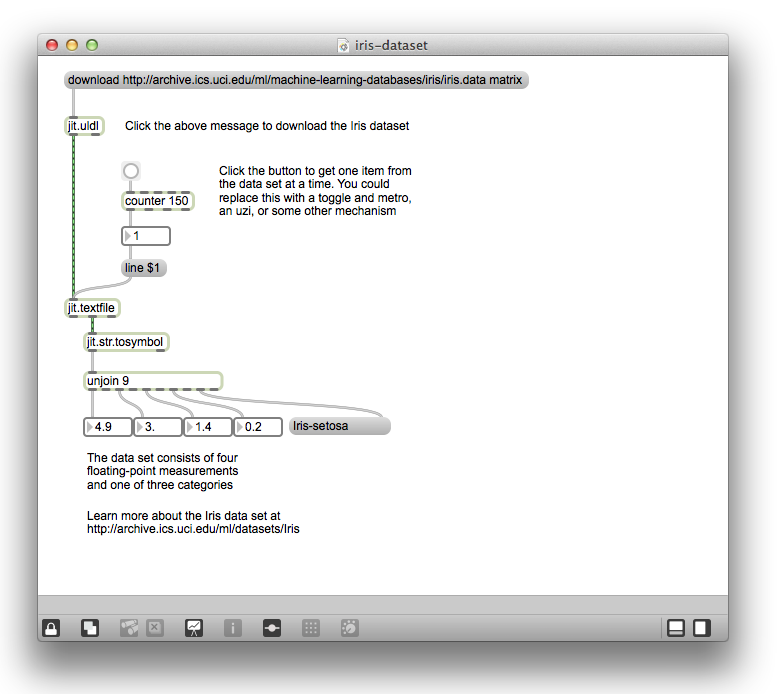
Since we haven’t covered this in class, I’ve made the following patch to help you grab the Iris Data Set from the University of California at Irvine’s Machine Learning Repository. The data set that we are going to explore is one of the most famous in the pattern recognition literature. It describes the measurements and classification of 150 different examples of Iris plants.
Scaling
Spend some time familiarizing yourself with the data. You will note that each of the four measurements (sepal length and width, petal length and width) are a small floating point number. In order to convert these values into something that can be easily visualized or sonified, you will probably want to use the scale object. The three classifications (Iris Setosa, Iris Versicolour and Iris Virginica) are currently stored as messages. You can use an object like select to convert these values into useful control information in your patch.
Patterns
The point of visualization or sonification is ultimately to find interesting patterns in data. Try mapping different data fields to different graphic or sonic attributes until you find a pattern that you like.
Please e-mail me if you have any questions or concerns.


You must be logged in to post a comment.